Welcome to the CMI-PB Challenge, a systems immunology competition. This is an exciting opportunity to explore the world of systems vaccinology by analyzing longitudinal immune response data obtained through cutting-edge multi-omics experiments. We have established a resource based on our Computational Models of Immunity to Pertussis Booster vaccinations (CMI-PB) Project to generate experimental data to create and test computational models that predict vaccination outcomes based on the baseline state of the vaccines.
Overview
The overall goal of the CMI-PB prediction challenge is two-fold. We want to:
- Establish a community platform to test and compare computational models of immunity in vaccination.
- Better understand vaccine-induced immunity to B. pertussis. By establishing and testing computational models that attempt to predict the cascade of events that follow B. pertussis booster vaccination, we will improve our understanding of the mechanisms underlying these events, with the ultimate goal of identifying what variables induce a strong and durable recall response.
The CMI-PB prediction challenge is an exciting opportunity to explore the complex world of systems vaccinology by utilizing longitudinal immune response data obtained through cutting-edge multi-omics experiments. With this challenge, the CMI-PB prediction contest hopes to foster a collaborative research community, addressing challenges and advancing scientific knowledge more rapidly than any individual or research group could achieve alone. We have successfully concluded two challenges: the 1st challenge with contestants from the CMI-PB member labs (results published here) and 2nd challenge (manuscript under preparation). During the 2nd challenge, we expanded the participant pool by inviting specific contestants outside the CMI-PB network before rolling out the 3rd public challenge.
Your task during this challenge is to predict outcomes, showcasing your intuition and analytical skills. To participate in the 3rd CMI-PB Prediction Challenge, utilize the provided training dataset to build your computational models and predict the vaccination outcomes of newly tested individuals (challenge dataset). To create a submission, use predictive computational modeling techniques to provide answers to the list of prediction tasks. The CMI-PB team will evaluate submissions from all the contestants and inform you of the outcome of the contest. Please review the 'Learn about the project' section to delve deeper into the topic. We have also provided teaching materials to explain the background and the motivation of the project.
When you're ready to begin, create an account and click the 'Submit Prediction' button in the upper right-hand corner of this page. To find these buttons, you must first scroll back up to the top of this page. No login is necessary to access the challenge data. However, login is required to record and track your submissions. We look forward to your participation!
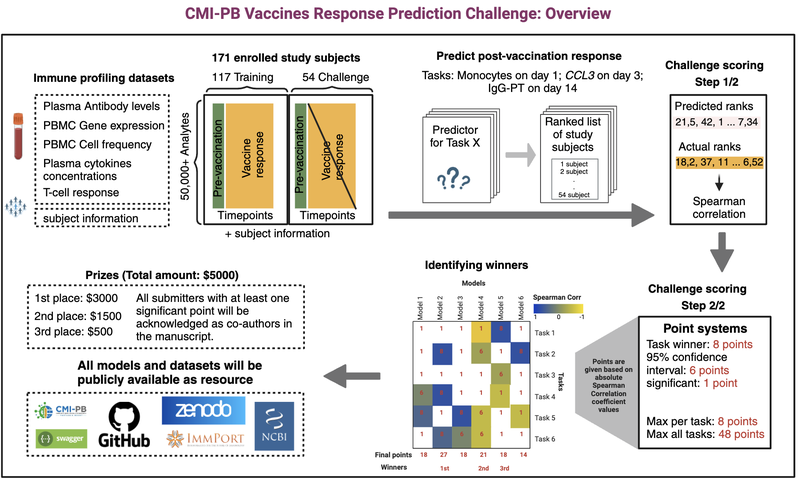
Figure 1: CMI-PB Challenge Outline.
Please see the CMI-PB Prediction Challenge timeline below.
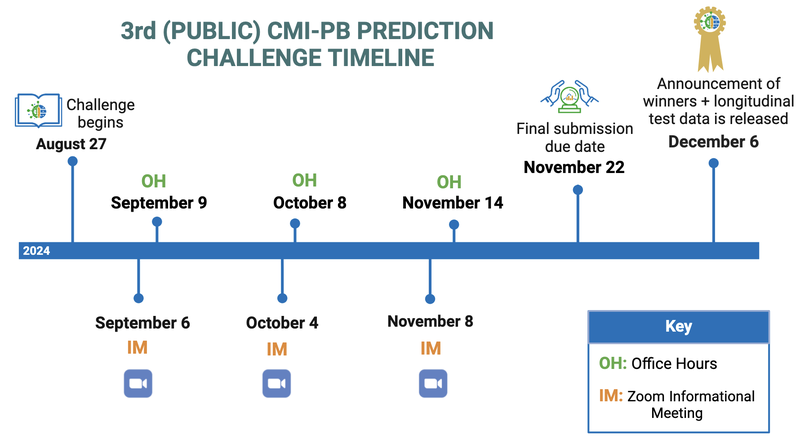
Figure 2: Prediction Challenge timeline.
Model Evaluation and Prizes
Model Evaluation/Ranking
After receiving all of your predicted ranked list for each task, we will curate the rank file. If we find NA values in the ranked list, we will impute them with the median rank for that list.
Model evaluation will happen in two steps:
First, we will choose the Spearman rank correlation coefficient as an evaluation metric to compare the predicted ranked list (p) for each task (t), and n subjects (n=54 for the set of challenge dataset subjects), Rp,t = (rp,1, rp,2, …, rp,n) against a ground truth (g) ranked list Rg,t = (rg,1, rg,2, …, rg,n).
Second, models will be evaluated and ranked based on a point system. The point system is as follows:
- 8 points: Task Winner (Highest Absolute Spearman Correlation)
- 6 points: High Correlation (Within 95% Confidence Interval of Task Winner)
- 1 points: Significant Correlation
The maximum points you can earn per task is 8 points and the maximum points you will be able to win overall is 48 points.
Prizes and Awards
- All submitters with at least one significant score will be acknowledged as co-authors in the manuscript written following this challenge.
- Additionally, prizes will be awarded to the top three teams with the best-performing models. The total money prize is $5500.
- 1st place: $3000
- 2nd place: $1500
- 3rd place: $500
- Bonus task winner: $500
- Please note that the bonus task is completely independent of the main challenge and will be evaluated separately. Read details here.
Prize Details:
- If there is a tie for first place, the prizes for first and second place will be combined and split equally among the winning teams. There will be no separate second-place prize awarded, and the team originally in second-place will receive the third place prize. The team originally in third place will not receive a prize.
- In the event of multiple teams tying for first place, the prizes for first, second, and third place will be combined and split equally among all the winning first-place teams. No separate second or third-place prizes will be awarded.
- If there is a tie for second place, the prizes for second and third place will be combined and split equally between the tied teams. The original third-place team will not receive a prize. This applies if there are multiple teams tied for second place.
- In the case of a tie for third place, only the prize for third place will be shared equally between the tied teams.
- Please note that the prizes are subject to tax withholdings depending on your location.
Data and resources
Study design and multi-omics datasets
Our cohort is composed of acellular-Pertussis (aP) vs whole-cell Pertussis (wP) infancy-primed subjects boosted with Tdap. We recruited individuals born before 1995 (wP) and after 1996 (aP), collected baseline blood samples, provided the Tdap booster vaccine, and then obtained blood at 1, 3, 7, 14, and 28 days post booster vaccination. We recommend reviewing the 'Learn about the project' and 'Understand the data' sections to delve deeper into study design, experimental data generation and standardization.
From the samples, we generated omics data by:
- Cell frequencies of PBMCs (30+ cell populations) using flow cytometry,
- PBMC gene expression (50,000+ genes),
- Plasma cytokine and chemokine concentrations (45+ proteins) using Olink and LegendPlex
- Plasma antigen-specific antibody measurements (multiple antigens, total IgG, and subclasses of IgG)
- T cell polarization using FluoroSpot assay
- T cell activation using AIM assay
Challenge data
The data has been split into two groups:
- Training dataset (Baseline and longitudinal readouts: 2020, 2021, and 2022 dataset). To build your computational models, use the training set, which includes the outcome (also known as the "ground truth") for each subject. Your model will be based on features extracted from longitudinal multi-omics readouts (seven assays) as well as demographic data (such as age, infancy vaccination, and biological sex). You can create new features using feature engineering techniques.
- Challenge dataset (Baseline readouts: 2023 dataset). Use the challenge dataset to evaluate your model's performance on new, unseen baseline data. The challenge dataset does not provide the ground truth (longitudinal vaccine response) for each subject. Your task is to predict these outcomes using the model you built. Use your model to predict the vaccine response for each subject in the challenge dataset.
Raw datasets can be downloaded using API endpoints or by directly downloading the files (sftp site) from the following locations.
- Datasets: Training datasets | Prediction dataset
The CMI-PB team has harmonized and processed the data to create computable matrices that are ready for direct use in model building. These processed datasets are intended to guide contestants through data harmonization and batch effect correction. However, we recognize that many contestants have developed their own data-processing pipelines in previous contests.
- Resource: Processed training and challenge datasets (R objects and TSV files)
- Codebase: [Rpubs] [GitHub]
Prediction challenge tasks
Overview:
Pre-vaccination information serves as crucial baseline data for predicting vaccine response. This includes:
1) Demographic data
- Age
- Biological sex at birth
- Vaccine priming status
2) Assays characterizing the immune status just before (baseline) and after the vaccine is given:
- Antibody measurements in plasma by Luminex
- Cytokine and chemokine concentration in plasma by Olink and LegendPlex
- Gene expression in PBMC by RNA-Seq
- Cell type frequencies in PBMC by Cytometry
- T cell polarization using FluoroSpot assay
- T cell activation using AIM assay
1) Antibody level tasks
1.1) Rank the individuals by IgG antibody levels against pertussis toxin (PT) that we detect in plasma 14 days post booster vaccinations.
1.2) Rank the individuals by fold change of IgG antibody levels against pertussis toxin (PT) that we detect in plasma 14 days post booster vaccinations compared to titer values at day 0.
2) Cell frequency tasks
2.1) Rank the individuals by predicted frequency of Monocytes on day 1 post boost after vaccination.
2.2) Rank the individuals by fold change of predicted frequency of Monocytes on day 1 post booster vaccination compared to cell frequency values at day 0.
3) Gene expression tasks
3.1) Rank the individuals by predicted gene expression of CCL3 on day 3 post-booster vaccination.
3.2) Rank the individuals by fold change of predicted gene expression of CCL3 on day 3 post booster vaccination compared to gene expression values at day 0.
4) T-cell response task (A Bonus task) - Updated on Oct 03, 2024
4.1) Rank the individuals by predicted Th1/Th2 (IFN-γ/IL-5) polarization ratio on day 30 post-booster vaccination.
Examples of models
- We generated 32 computational models during the 1st (internal) challenge. These models can be accessed here
- We generated 48 computational models during the 2nd (invited) challenge. These models can be accessed here
- We also generated sample models on the 3rd challenge training dataset for demonstration purposes. These models can be accessed here
- Access demonstration of model construction and submission file preparation process here
Submission instructions
Creating an account
- You must register and login to enter a submission into a challenge. After logging in, you can download the data and make a submission using the steps outlined below.
- An "Entry" is complete and will be evaluated when the data is submitted in the layout and tsv format specified on the website, located on the prediction task page.
- All entries must be during the competition period, displayed on the prediction task page.
- The ultimate goal is to model as many of the tasks as possible and submit your prediction by the due date.
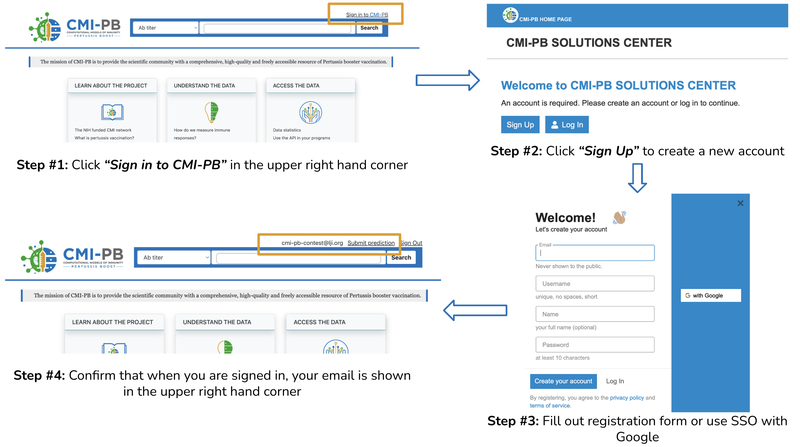
Figure 3: Creating an account.
Submission Restrictions
- You are allowed 1 final entry per account, but can re-submit as many times as you would like until the deadline. Note that your last submission will be considered your ‘final’ version (final entry).
- If you have developed multiple modeling approaches and wish to enter multiple entries for evaluation, please create separate CMI-PB login accounts to manage these entries.
- Please reach out to the CMI-PB team via email at cmi-pb-challenge@lji.org if there are any issues.
- External data is not allowed. Participants agree not to attempt to use additional data or data sources not provided.
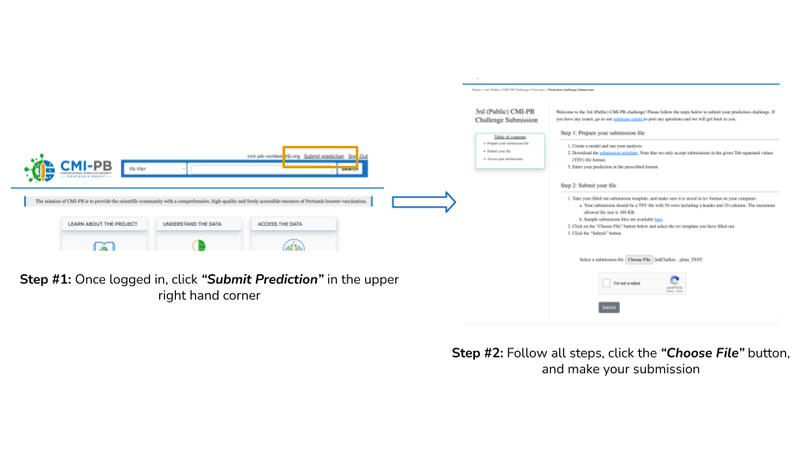
Figure 4: Submission Process