Study outline
To study the long-term effects of priming between the acellular-pertussis (aP) vs. whole-cellular pertussis (wP) vaccines, we have recruited individuals born prior to 1995 and those born after. Those born before 1995 have been primed with the wP vaccine in infancy while those individuals born later have been primed with the aP vaccine. The recruited individuals are those now eligible for Tdap booster vaccinations which contain tetanus toxoid (T) diphtheria toxoid (d), and acellular-pertussis (ap; FHA, Fim2/3, PRN, and pertussis toxin) antigens.
Study specimens will be collected longitudinally from blood at pre- (day 0) and post-vaccination (days 1, 3, 7, 14, and 28) time points. In total, approximately 5000+ specimens will be collected and analyzed during the course of five years. For each challenge, we aim to have 16 aP donors and 16 wP donors. This data would allow us to understand how the immune system responds to pertussis antigenic challenge in vivo as a proxy of infectious challenge and whether this response differs in aP vs. wP-primed individuals years after the original vaccination.
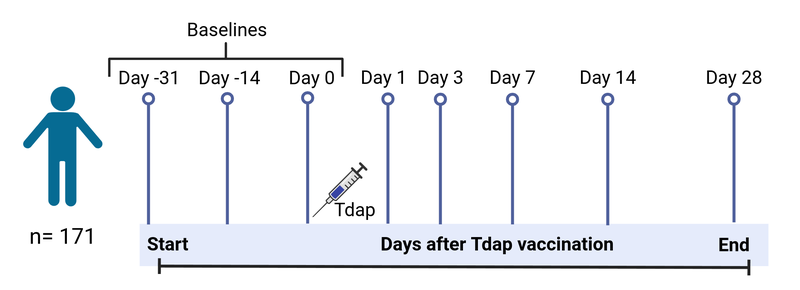
Figure 1: Study timeline.
Sample and data collection
We provide longitudinal data generated from 500+ blood specimens provided by 171 subjects using seven assays: PBMC cell frequencies, PBMC gene expression, Plasma cytokine concentrations (Olink and LEGENDplex), Plasma antibody measurements, T cell activation, and T cell polarization.
More on the data:
We systematically analyzed baseline levels and post-booster vaccination changes of:
- PBMC cell type frequencies for N=122 subjects. Timepoints measured: Baseline, days 1,3,7,14
- Gene expression analysis on PBMCs Samples that did not pass quality controls were removed and complete-time courses were obtained for N=146 subjects. Timepoints measured: Baseline, days 1,3,7,14
- Plasma cytokine and chemokine concentrations of 45+ proteins of N=107 subjects. Timepoints measured: Baseline, days 1,3,7,14
- Antigen-specific IgG, IgG subclasses (IgG1-4) for N=166 subjects. Timepoints measured: Baseline, days 1,3,7,14
- t_cell polarization using FluoroSpot assay for N=99 subjects. Timepoints measured: Baseline, day 28
- t_cell activation using AIM assay for N=101 subjects. Timepoints measured: Baseline, day 28
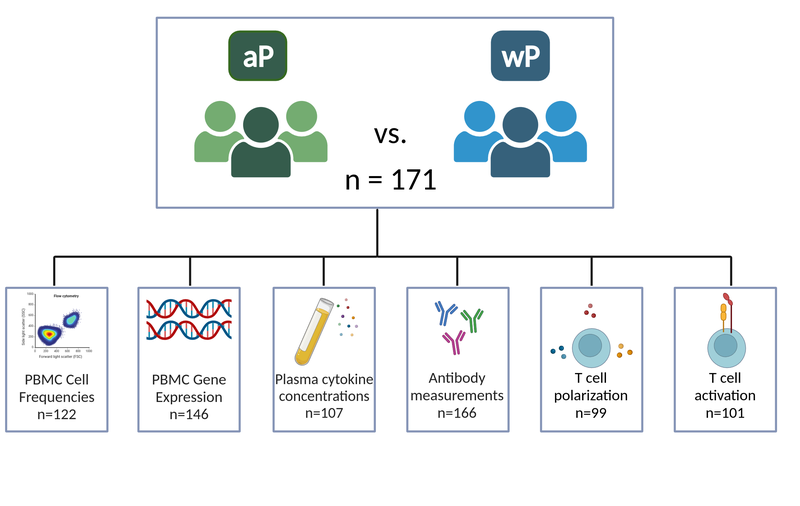
Figure 2: Study outline.
This data has worked for designing the database schema, testing data models, and demonstrating visualization tools that will be available for public access through a web interface. Furthermore, this data has been used for the second prediction challenge, where datasets have been split into training and challenge datasets.
Our approach to data standardization
Standardized nomenclature is a key aspect of the CMI-PB project to allow for a consistent understanding of the data available. Here, the central database, discussed below, will play an important role by unifying existing scientific nomenclature and classification with a data structure suitable for analysis. For example, each macromolecular entry in experimental data will be linked to its standard nomenclatures and classification resources as well via the CMI-PB terminology.
Approach for the CMI-PB central database schema
CMI-PB central database is implemented as a Relational Database Management System (RDBMS), and as such, consists primarily of a collection of table definitions, each of which corresponds to a high-level category of entity. Above these tables, the CMI-PB central database is divided into three different categories, where each category features distinct domains of the data (Figure 3). These table categories include information, experimental data, and metadata/ontology tables. These categories represent the top level in the data hierarchy used to store different sets of information into the CMI-PB database.
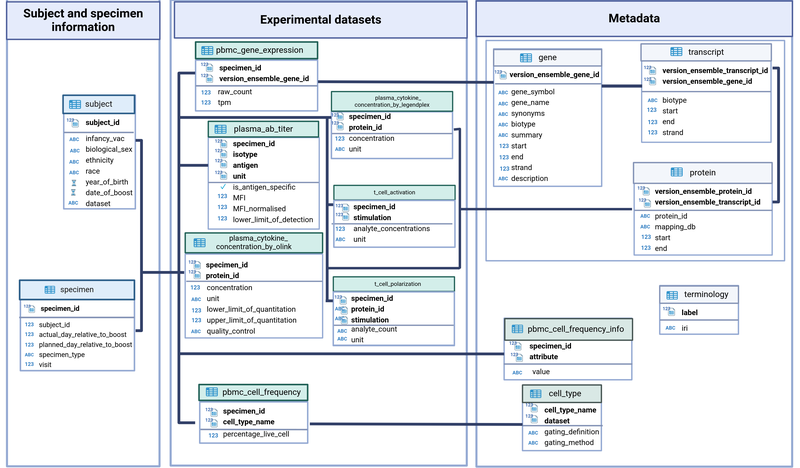
Figure 3: CMI-PB central database schema.
A) Information tables:
- subject: Each row in the subject table represents an individual given a unique identification number (column name: subject_id). Other fields provide information about infancy vaccination status, TDaP (tetanus, diphtheria, and acellular-pertussis) vaccination booster date, and subject-specific information such as date of birth, biological sex, ethnicity, race, etc.
- specimen: Each row in the subject table represents a clinical sample e.g., blood (specimen_id) for a subject (subject_id) at the particular visit. Additionally, information about the Nth visit, sample type, e.g., PBMC and days count relative to the boost is provided.
B) Experimental data tables:
These tables include data from mass cytometry, gene expression, antibody titer, and protein expression experiments. Each experimental data table has experiment-specific information.
- PBMC_cell_frequency: Each row in the PBMC_cell_frequency table represents a specimen (specimen_id) along with the names and values for measured analytes, such as cell population name and percent live cell.
- plasma_gene_expression: Each row in the plasma_gene_expression table represents a specimen (specimen_id) along with the names and values for measured analytes such as gene (versioned_ensembl_gene_id) and tpm and raw count for each gene.
- plasma_ab_titer: Each row in the plasma_ab_titer table represents a specimen (specimen_id) along with the names and values for measured analytes such as antigen and IgG isotype with corresponding antibody titer. Antibody titer is represented by Mean Fluorescence Intensity (MFI) units.
- Plasma_cytokine_concentrations by Olink: Each row in the plasma_cytokine_concentrations table represents a specimen (specimen_id) along with the names and values for measured analytes such as the Olink protein identifier with corresponding protein expression values (cytokine concentration, pg/ml) and quality control values.
- Plasma_cytokine_concentrations by LEGENDplex table represents a specimen (specimen_id) along with the names and values for measured analytes, such as the protein identifier with corresponding protein expression values
- t_cell polarization table represents a specimen (specimen_id) along with the names and values for measured analytes (analyte concentration and unit).
- t_cell activation table represents a specimen (specimen_id) along with the names and values for measured analytes (analyte concentration and unit).
C) Metadata/ontology tables:
This category includes metadata about genes, protein identifiers, and supplementary information to experimental data tables. For instance, cell populations are identified using the gating definition, and it is redundant to keep this information within the PBMC_cell_frequency table. Therefore, a separate metadata table is created and linked.
- gene, transcript, and protein: These three metadata tables include gene and protein mapping information available in public databases such as Ensembl, Entrez, Uniprot, etc. Herein, gene, transcript, and protein ids are mapped to one another.
cell_type: It provides additional information about each cell population with their corresponding gating scheme used.
Browse our terminology
CMI-PB terminology browser is a system made for creating, maintaining, and sharing an application ontology that builds on multiple reference resources. It will serve as a reference resource to annotate and systematically explain the terms used for the study design, experimental data, and metadata. We intend for the CMI-PB terminology browser to be general (as it has the potential to be used for other projects), but the primary goal is to serve this CMI-PB project. Users can search, browse, and query the CMI-PB Terminology browser using a uniform web-based interface and API.